Meghan's Blog
Travel adventures
World perspectives
Growing thoughts
World perspectives
Growing thoughts
|
By: Meghan Holland
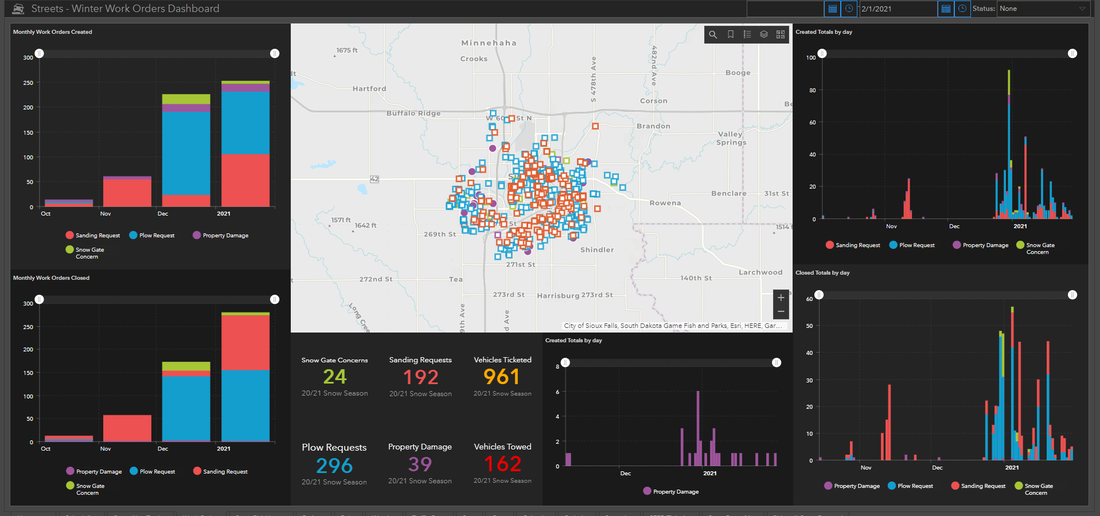
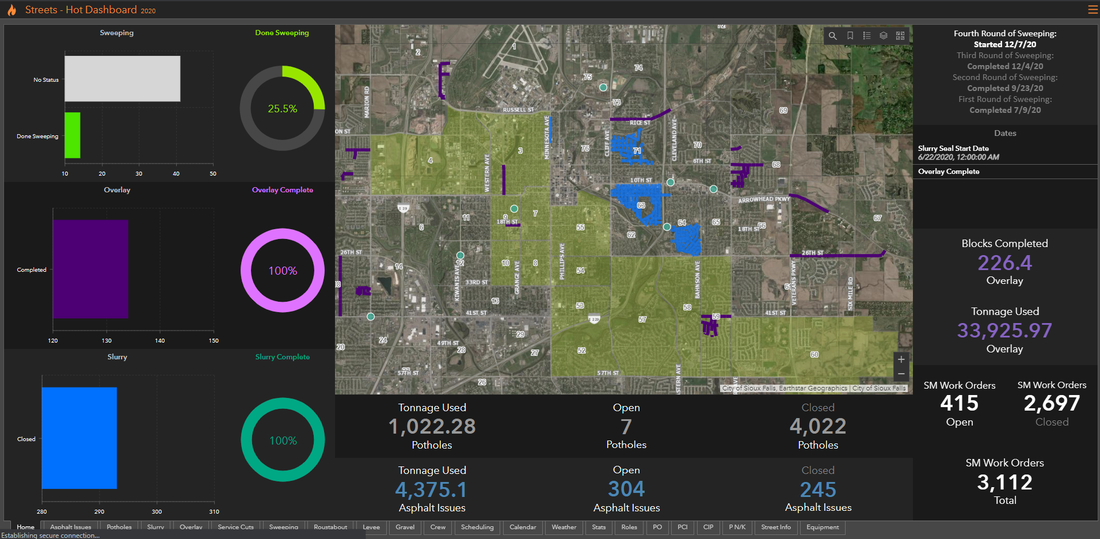
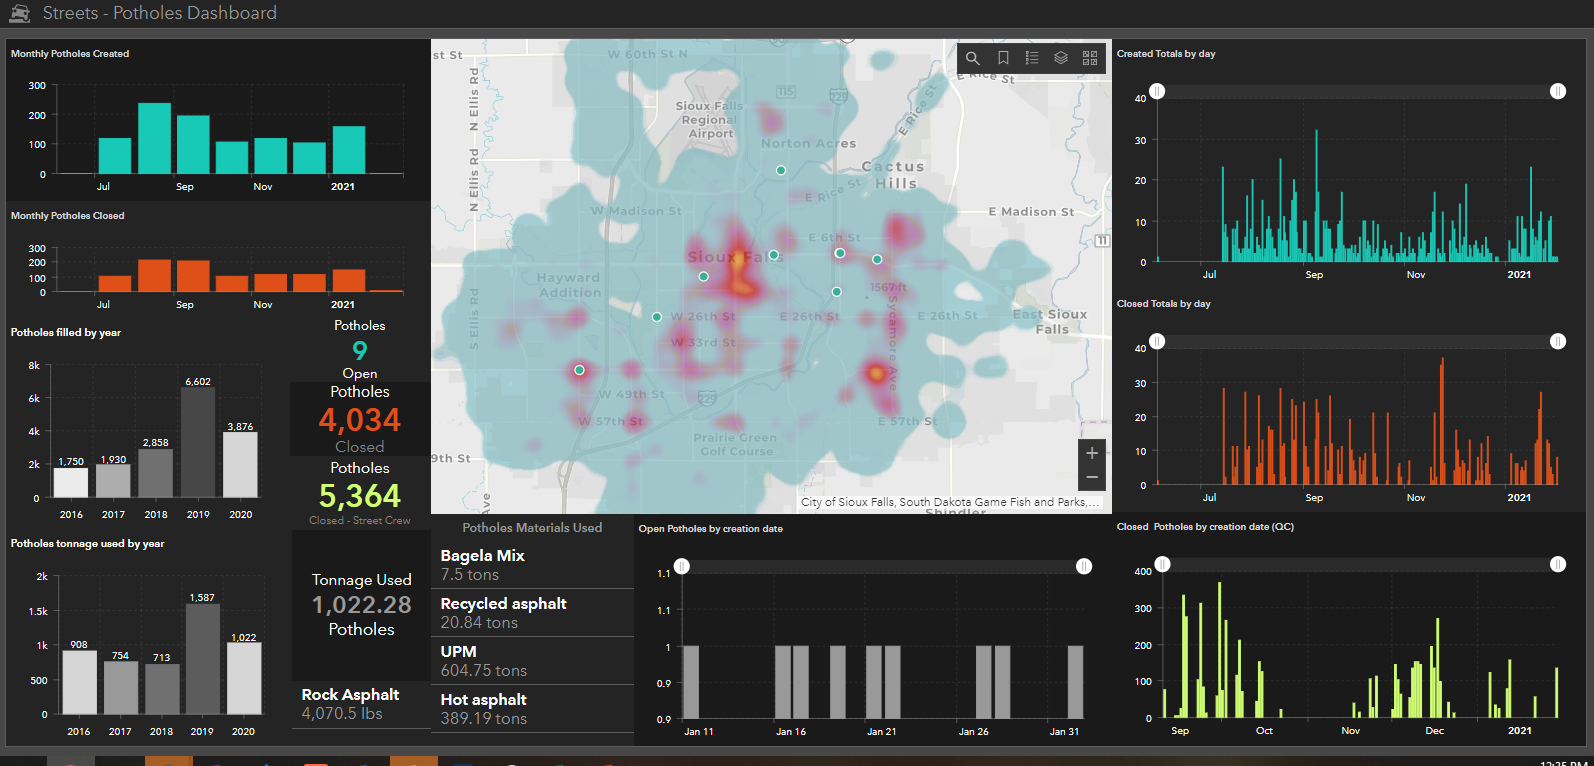
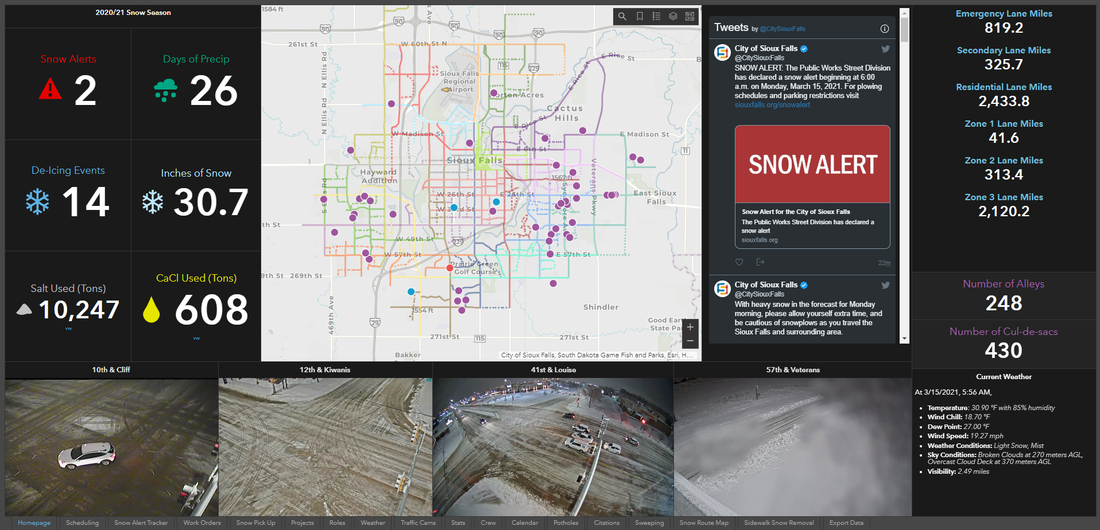
The Street Department manages the highways and streets for all of Sioux Falls, which covers 80 square miles. As a way to track and compile data related to that management, the city created dashboards that are easy to view and can help with decision-making processes. The city defines public innovation as the process of generating and implementing ideas that create value for the community. The innovation of using these dashboards results in greater efficiency and productivity through asset management. The city maintains two dashboards, one for warmer temperatures (summer) and one for colder temperatures (winter), to track data related to construction, street preparations, safety precautions and even a crew’s location and work status. The summer dashboard covers street maintenance such as pothole patching, asphalt overlay and any type of surface maintenance. The winter dashboard covers things related to snow and ice control, such as salt usage and the amount of snowfall the city receives. Kristin Lobien, Street Logistics Specialist, said that each dashboard has tabs within them tracking more specific data. With the new asset management software, she said data tracking is much simpler. “Before, I would have to go into a table and put that data in,” Lobien said. “Now, we have it tied on the backside, so when the employees put how many tons (of asphalt) they put out on a roller, it automatically updates our dashboards.” Lobien said the data is being recorded 24 hours a day with information coming in from crews working around the clock. An example of how the dashboard works is the pothole operation, which is its own tab within the summer dashboard. “We can see how many potholes are generated each day from our requests to how many potholes are closed per day by the crews,” Dustin Hansen, Street Operation Manager, said. “We can even go back and look at where each pothole request is located within the city, and we can go back multiple years.” Hansen said he is heavily involved in day-to-day operations, and when he thought of this idea, it was Lobien and Austin Brynjulson, Civic Analytics Specialist, who really brought it into fruition over the last two years. Brynjulson said the dashboard itself is accessed via a URL, so it is stored in the Civic Analytics Department, formerly known as the Geographic Information Systems (GIS) Division, and when someone needs access to it, they must have an account to receive the URL. He said the process of collecting data through different sources, such as pulling weather from the National Weather Service, updates from crews, requests from citizens, etc. has been innovative for the city. Hansen said the dashboards are primarily for internal use by all employees of the Street Department as well as some city employees outside of the department. “It’s a good tool for not only management, but for others to really dive into the data and see where our problem areas are at (and where we need) to focus our resources,” Hansen said. He said the city prides itself on being efficient and providing good customer service, so this is another tool they can use for that. “It’s always going to be evolving,” Hansen said. “It’s always going to keep growing.”
0 Comments
Leave a Reply.AuthorI am an aspiring photographer, writer, and adventurer. I love the outdoors and I love to tell a great story with pictures! Archives
July 2021
Categories
All
|


 RSS Feed
